MapVOWL is visual notation for Linked Data mappings. It specifies the ambiguous visualization primitives to represent mapping rules to users. Furthermore, it specifies how interaction with the mapping rules is done through the visualization.
Status of This Document
This document is merely a public working draft of a potential specification. It has no official standing of any kind and does not represent the support or consensus of any standards organisation.
1. Introduction
This section is non-normative.
Linked Data [LINKED-DATA] is a way to create a network of standards-based machine interpretable data across different documents and Web sites. It allows an application to start at one piece of Linked Data, and follow embedded links to other pieces of Linked Data that are hosted on different sites across the Web.
In most cases Linked Data is generated based on existing data. Mapping languages, through rules, allow users to define how this is done, such as R2RML [R2RML] and RML [RML]. Vinoma offers a visualization to define these rules.
2. Terminology
2.1 General
resource
A resource is something in the world (the "universe of discourse"). Anything can be a resource, including physical things, documents, abstract concepts, numbers and strings.
referent
The resource denoted by an IRI is called its referent.
blank node
It is sometimes handy to be able to talk about resources without bothering to use a global identifier, such as done for referents. This can be achieved by using a blank node.
literal value
The resource denoted by a literal is called its literal value. Examples are the name of a person, the VAT number of a company and so on.
relationship
Relationships between referents, blank nodes and literal values can be expressed. This is indicated by a predicate, which is an IRI and denotes a property.
input data source
An input data source is source of data that is used to generate Linked Data.
value type
A value types of referents and literal values describe how the their values are generated. There are two possibles value types: templated data extract and constant.
templated data extract
This value type means that you copy the data from the input data source and that you optionally can perform a transformation on it. For example, you can add a prefix to a identifier in order to generate URIs. How the template is defined can be found here.
constant
This value type means that you do not use data from an input data source and you provide a constant value.
schema
A schema is either a vocabulary or an ontology. There is no clear division between what is referred to as 'vocabularies' and 'ontologies'. The trend is to use the word 'ontology' for more complex, and possibly quite formal collection of terms, whereas 'vocabulary' is used when such strict formalism is not necessarily used or only in a very loose sense. Vocabularies are the basic building blocks for inference techniques on the Semantic Web [W3C-ONT].
class
Both an referents and an literal values can have a type. In the case of an referent we use the term class. For example, we state that the class of an referent is a 'Person' (using foaf:Person) if the input data source describes employees. Note that an referent can have zero or more types.
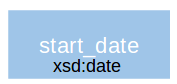
datatype
Both an referents and an literal values can have a type. In the case of an literal value we use the term datatype. For example, we state that the datatype of an literal value is a String (using xsd:string) if the literal value represents the name of an employee. Note that a literal value can at most have one type.
path
Hierarchical structured data, such as XML and JSON files, makes use of paths to refer to data fractions.
2.2 Visualization
node
A node is a visual representation of either a referent, blank node or literal value.
link
An link is a line connecting two nodes. It represents the relationship between (1) two referents, (2) two blank nodes, (3) one referent/blank node and one literal value or (4) one referent and one blank node.
graph
A graph is a collection of nodes and links.
3. Grpahical Primitives
The graphical primitives are used to define the mapping rules.
Name
Primitive
Description
circle
referent
dashed circle
blank node
rectangle
literal value
relationship label
line
relationship
arrowhead
relationship direction
text
text
textual information about mapping definitions
4. Colors
First, the different types of colors are defined. Next, the different color schemas are defined in terms of the types.
4.1 General
Abstract Color Name
Concrete Color Recommendation
Description
Application
canvas
#ffffff
white
Bright color with a good contrast to all other colors.
canvas where are all other graph elements are shown on
foreground
#000000
black
Very dark color with a good contrast to all other colors.
border of elements and edges
base color
see next table
Every data source has its own base color, unique for every source.
fill color of the graph elements that use data from that specific data source.
highlight
see next table
For each element coming from a source, and property, the highlight color is a darker shade of the base color of that source or property.
fill color of the graph elements when selected
4.2 Color Schemas
Input Data Source Color Schema Name
Base Color
Highlight
Scheme #1
#6d9eeb
#1155cc
Scheme #2
#f6b26b
#b45f06
Scheme #3
#93c47d
#38761d
Scheme #4
#c27ba0
#741b47
Scheme #5
#ffd966
#bf9000
Scheme #6
#76a5af
#134f5c
Scheme #7
#8e7cc3
#351c75
Scheme #8
#e06666
#981c1c
blank node
#ffffff
#b7b7b7
no input data source
#ffffff
#b7b7b7
5. Mapping Rules
First, we elaborate on how the mapping rules are visualized. Next, we elaborate on what is not shown through the visualizations.
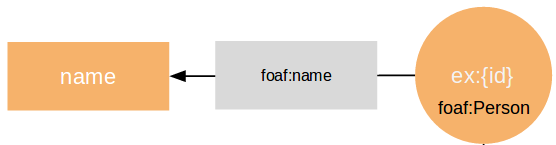
referent, with class, has relationship with literal value
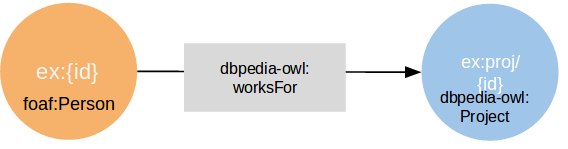
referent has relationship with another referent
6. Interaction
Interaction elements are added to the graphs in order to allow updates of the mapping rules. These elements are only shown when the user hovers over the graph element.
Interaction Element
Application
Action
show details
Bring up window where details of mapping rule can be edited.
add relationship
Link appears and is dragged to corresponding target of relationship.